Quality Score sits in your Google Ads keyword report as a number from 1 to 10. Most advertisers glance at it, maybe sort by it once, and move on. That is a mistake. Quality Score is not a vanity metric. It directly shapes what you pay per click on every keyword in your account.
Here is the practical version. Quality Score is one of the primary inputs into Ad Rank, the formula Google uses to decide whether your ad shows and where it lands on the page. A higher Quality Score means your ad can outrank a competitor while you pay less per click.
The reverse is also true: a keyword with Quality Score 3 can pay two to four times more per click for the same position as the same keyword at Quality Score 8. That difference is real money, and it compounds across every click for as long as the problem goes unfixed.
This guide covers what Quality Score actually is, how each component is calculated, how to diagnose problems by component, and how to fix them.
How Quality Score Is Calculated
Quality Score has three components. Each one is rated as Above Average, Average, or Below Average, and each one points to a different problem with a different fix.
The first is Expected CTR. Google estimates how likely someone is to click your ad when it appears for this keyword, relative to other ads competing for the same query. Historical CTR feeds this estimate, adjusted for factors like ad position.
The second is Ad Relevance. This is how closely your ad copy matches the intent of the search query. A below-average rating here usually means your ad group is too broad. One ad is being asked to serve too many different keyword themes, and it cannot be tightly relevant to all of them.
The third is Landing Page Experience. Google evaluates how useful, relevant, and trustworthy your landing page is for someone clicking your ad on this keyword. Page content relevance, page speed, mobile usability, and ease of navigation all factor in. This component is generally understood to carry the most weight.
A note on certainty: Google does not publish the exact formula for how those three component ratings translate into the 1-10 score. The relationships described here are well established through industry observation, not lifted from a published specification.
Why Quality Score Matters: The Math
Google's auction is not a simple highest-bidder-wins setup. Position and the actual cost-per-click you pay are both decided by Ad Rank, which is approximately:
Bid × Quality Score × Expected Impact of Ad Extensions
In practice, that means a higher Quality Score effectively multiplies your bid. Two advertisers can place the same dollar bid and end up in very different positions, paying very different prices, based on the strength of their Quality Score.
Here is a simplified illustration:
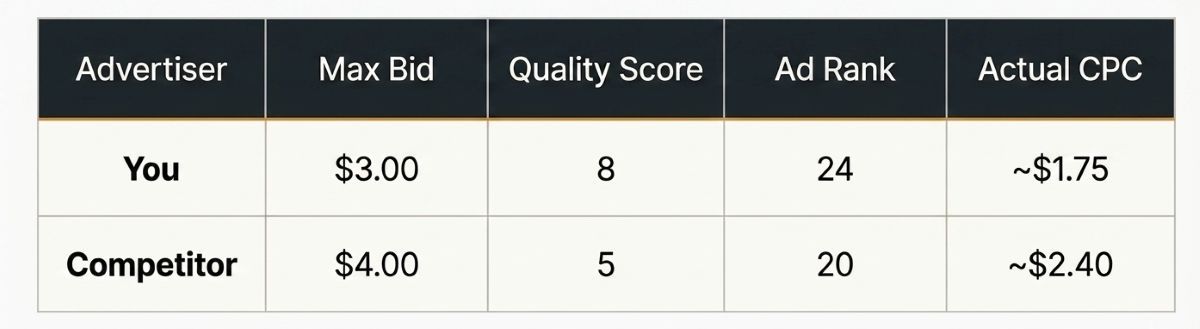
You rank above a competitor bidding 33% more than you, and you pay less per click. That is the Quality Score advantage in concrete form. Flip the scenario, and you get the Quality Score tax: paying more per click for lower positions.
Translate it into dollars. On a keyword spending $500 a month at Quality Score 4, lifting to Quality Score 7 could trim cost-per-click by 30 to 50 percent. That frees up $150 to $250 a month from a single keyword without touching the bid. Across an account with dozens of low Quality Score keywords, the savings compound quickly.
Reading Your Quality Score Data
Pulling Quality Score into your keyword view takes about thirty seconds. In Google Ads, click Audiences, keywords, and content in the left navigation panel. Click Search keywords. Click the Columns icon above the statistics table. Select Attributes from the column categories, then add Quality Score, Exp. CTR, Ad relevance, and Landing page exp. Click Apply, and the columns will appear in your keywords table.
That is the easy part. Reading the data well is what separates an audit from a glance.
A raw list of Quality Score values is not an audit. The number that matters is your spend-weighted average Quality Score, which is the average across all keywords weighted by what each keyword actually costs. A Quality Score of 3 on a keyword spending $10 a month is a small problem. A Quality Score of 3 on a keyword spending $800 a month is a large and expensive one.
To find your real priorities, sort by Cost descending and scan the Quality Score column. The intersection of high spend and low Quality Score is where to focus first. As a rough industry benchmark, a spend-weighted average of 5 to 6 is typical, above 7 is well-optimized, and below 5 warrants a systematic review.
Diagnosing QS Problems by Component
Each component points to a distinct underlying problem with a distinct fix. Treating them all the same is the most common reason Quality Score work fails to move the number.
Expected CTR: Below Average
What it means: Google predicts your ad will be clicked less often than competing ads for this keyword. If your ad has been running, the estimate is partly based on actual historical CTR.
Common causes include ad copy that does not include the keyword or close variants in the headline, a value proposition that is weaker than the competition, and ads that are technically eligible for queries they were never written for, usually because the ad group is too broad.
To fix it, write headlines that include the keyword or the core intent of the search query. Someone searching "project management software for small teams" should see "Project Management for Small Teams" in the headline, not a generic brand tagline. Use Responsive Search Ad asset pinning or ad customizers to make sure the most relevant headline appears for each query theme. If a single ad is serving a wide range of queries, split the ad group. Tighter ad groups produce more relevant ads, and more relevant ads earn more clicks.
Ad Relevance: Below Average
What it means: Google sees a mismatch between the keyword's intent and what your ad actually says.
Common causes are ad groups stuffed with too many different keyword themes, ad copy, and landing pages that are too generic to feel specific to any one keyword, and keywords that were added to an account but never had their ad copy updated.
To fix it, restructure ad groups around single themes. If you have 25 keywords sharing one ad group, you almost certainly have multiple intent clusters that should be separated. Each cluster gets its own ad group with copy written specifically for that theme. The ad should mirror what the keyword promises. If the keyword is "enterprise accounting software," the headline should say "Enterprise Accounting Software," or something very close to it, not "Powerful Tools for Finance Teams."
Landing Page Experience: Below Average
What it means: Google has assessed your landing page as not particularly useful or relevant to people searching for this keyword. This is the highest-weighted component, and it is the one most often neglected.
Common causes include sending paid traffic to a generic homepage rather than a keyword-specific page, slow page loads (especially on mobile), content that does not match what the ad promised, intrusive pop-ups, and pages that fail to offer a clear next step.
To fix it, match the landing page to the keyword's intent, not just the product category. Someone clicking an ad for "accounting software for freelancers" should land on a page about freelancer features, not your generic pricing page. Run your pages through [Google's PageSpeed Insights](https://pagespeed.web.dev). Any score below 70 on mobile is costing you Quality Score points and conversion rate at the same time. Make sure the landing page contains the keyword or its semantic equivalents in the headline and body text. Google crawls these pages for relevance. Then strip out friction: unnecessary redirects, interstitials, and broken elements all drag the rating down.
What Quality Score Cannot Tell You
Quality Score is useful, but it has real limits. Knowing them keeps you honest about the tool.
It is a current snapshot. Google does not provide historical Quality Score by day in standard reporting. You cannot pull a chart showing a keyword sat at Quality Score 6 last month and slid to 4 this month. Tools that claim to track Quality Score over time are approximating from periodic snapshots, not reading native history.
It is keyword-level. There is no single "account Quality Score." Any tool or report that hands you one is calculating an average, not surfacing a native metric.
A high Quality Score does not guarantee conversions. Quality Score measures relevance and click quality, not whether your offer or pricing actually closes the sale. A keyword can sit at Quality Score 9 with a strong landing page experience and still convert poorly because the offer is wrong.
The right model: Quality Score is a diagnostic, not a goal. Fix the three underlying problems. The score follows.
A Note on Quality Score and Performance Max
Everything in this guide applies to Search campaigns. Performance Max campaigns do not expose traditional keyword-level Quality Scores in the UI.
If your account is mostly Performance Max, your ability to diagnose Quality Score-style relevance problems is more limited. PMax reporting is aggregated and does not surface keyword-level data the way Search does. For Search, the framework here applies directly. For PMax, focus on asset group performance ratings (Learning, Limited, Good, Excellent) and search term reporting, which Google expanded access to in 2025.
How to Prioritize QS Improvements
Once you start looking, you will probably find more low Quality Score keywords than you can fix in a sprint. A simple priority sequence prevents paralysis.
Step 1: Find your spend-weighted floor. Sort keywords by Cost descending and add the Quality Score column. Any keyword spending more than $100 a month with Quality Score 4 or below is a priority-one fix. These are paying the highest tax on the most spend.
Step 2: Diagnose by component before acting. For each priority keyword, look at which component is Below Average. The component tells you where to work. Do not rewrite ad copy when the problem is the landing page.
Step 3: Fix landing page issues first. Landing Page Experience is the highest-weighted component, and improvements there benefit every keyword pointing at the page. Ad copy fixes benefit only one ad. Structural fixes (ad group splits) benefit the whole ad group. Work in descending order of leverage.
Step 4: Give changes time. Quality Score updates based on accumulated impressions data. A landing page fix will not show up the next day. Allow two to four weeks of impression volume before evaluating whether a change worked.
Step 5: Repeat. Quality Score is not a one-time project. Keyword performance, competitor ad copy, and landing page quality all shift over time, and the score shifts with them.
See Your Own Quality Score Picture
The framework above is the diagnostic process in full. Running it manually means exporting your keyword data, building a spend-weighted Quality Score calculation in a spreadsheet, cross-referencing which keywords carry the worst combination of high spend and low score, and then breaking that down by component. It works, but it is hours of spreadsheet time you would probably rather spend somewhere else.
Kindling runs the same analysis automatically from your Keywords CSV. You get a spend-weighted average Quality Score, a list of your low-Quality Score, high-spend keywords, a component breakdown showing what percentage of your keywords have Below Average Landing Page Experience versus Expected CTR versus Ad Relevance, and a dollar-impact estimate of your Quality Score tax.
The full Keyword Health section unlocks in the paid report. The overall score and section-level findings appear in the free tier the moment your CSV uploads.
>**See your account's Quality Score distribution.**
Find out which keywords are paying the Quality Score tax, and how much it is costing you.
Upload your Keywords CSV to get your free score.
**Start free audit**

Jered Sanchez
Jered is the founder of Panther City Data. He's spent fifteen years turning messy data into software people actually enjoy using. Marketing degree, engineering brain, design obsession.